How accurate is card centering from a photo? Our test
Our regression test measures what the current engine can establish from photos, not a professional grade. We review automatic card contours and compare readable border ratios with frozen manual annotations. Correcting the contour can help one axis while worsening another, so both confirmation steps remain necessary. This convenience sample does not establish accuracy for all cards.
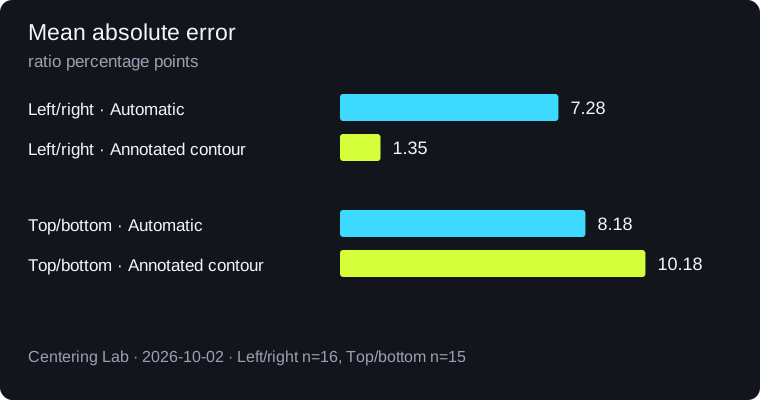
Results and coverage
Left/right
- Automatic: Mean absolute error 7.28 ratio percentage points; Median 2.67, Maximum 23.92. Measured / eligible: 16/16; Within 3 points: 9/16.
- Annotated contour: Mean absolute error 1.35 ratio percentage points; Median 1.08, Maximum 4.89. Measured / eligible: 16/16; Within 3 points: 15/16.
Top/bottom
- Automatic: Mean absolute error 8.18 ratio percentage points; Median 3.26, Maximum 34.87. Measured / eligible: 15/15; Within 3 points: 6/15.
- Annotated contour: Mean absolute error 10.18 ratio percentage points; Median 4.75, Maximum 31.07. Measured / eligible: 15/15; Within 3 points: 7/15.
All readable axes
- Automatic: Mean absolute error 7.71 ratio percentage points; Median 3.01, Maximum 34.87. Measured / eligible: 31/31; Within 3 points: 15/31.
- Annotated contour: Mean absolute error 5.62 ratio percentage points; Median 1.66, Maximum 31.07. Measured / eligible: 31/31; Within 3 points: 22/31.
What was actually measured
The photo set contains repeated views of some cards, transparent holders, binder pages and one object that is not a card. Contour correctness is a visual inspection of the current overlays: the boundary must follow the physical card cut. It is not a millimetric certification, and a correct contour does not certify the inner printed lines.
The ratio subset uses frozen manual annotations in tests/real-truth.json. Each readable axis has three pairs of cut/print positions at 20%, 50% and 80% of the side. The target is the largest border percentage across those stations. Annotation precision is approximately ±2 pixels; ambiguous printed borders are excluded rather than assigned zero width.
Automatic mode runs the unchanged engine. Annotated-contour mode fits straight physical cut lines through the manual positions, maps their intersections back to the original photo and reruns the engine with that quadrilateral. It simulates the first confirmation. It is not a study of users correcting corners, and it does not test the second confirmation of printed lines independently.
Difficult cases and limits
Holo glare can obscure a boundary; dark or interrupted printed borders can confuse artwork with a measurable frame. Transparent sleeves and holders can be selected instead of the card. Cropped scans lack surrounding context and are counted separately from camera photos. Full-art cases without a defensible printed boundary have no invented numeric truth.
The vertical mean error increases after the annotated-contour simulation even though more axes are within three ratio points. Averages, medians, maximum errors and coverage therefore appear together. This sample cannot support a universal accuracy percentage, a probability of a PSA 10 or a promise that confirmation removes every error.
Why there are two confirmations
First, confirm the physical card corners. Second, check the cut and printed lines on the rectified image. The two checks concern different boundaries. A plausible automatic ratio can still be wrong; if no coherent printed frame is visible, do not force a measurement. Read the measurement method and the glossary.
Reproduce and cite
Evaluation date: 2026-10-02. The downloadable aggregate records the engine, photo-set and truth hashes. Run npx tsx scripts/eval-public.ts "private photo folder" --write against the original private fixture set; without --write the script compares the fresh result with the published JSON. For the private visual overlays run npm run eval -- "private photo folder".
Download the aggregate JSON. Original photos and per-photo overlays are not distributed. Cite Centering Lab, this page, the evaluation date and the JSON version. Source: our reproducible regression evaluation, with protocol and limits stated here.
Centering Lab · Updated on